
Modern genomics pipelines require robust and reliable software to analyse the complex and often large reams of data that can be generated from such experiments (Figure 1.). Modern day research and diagnostic laboratories conducting cytogenetic-based experiments are often using microarrays to detect constitutional copy number aberrations such as losses and gains of chromosomal segments, or other chromosomal abnormalities such as losses of heterozygosity (LOH).
Such aberrations are responsible for a swath of genetic disorders such as DiGeorge syndrome (22q11.2 deletion syndrome), Williams syndrome (7q11.23 deletion syndrome), Cri-du-chat syndrome (5p deletion syndrome), Smith-Magenis syndrome (17p11.2 deletion), Potocki-Lupski syndrome (17p11.2 duplication) and Wolf-Hirschhorn syndrome (4p deletion). Examples of disorders related to LOH caused by uniparental disomy (UPD) include Angelman and Prader-Willi syndromes. Analyses to detect such disorders can be accomplished using array comparative genomic hybridization (aCGH) and microarrays targeting single nucleotide polymorphisms (SNPs). Agilent offers solutions for this through their CGH+SNP and CGH microarrays.
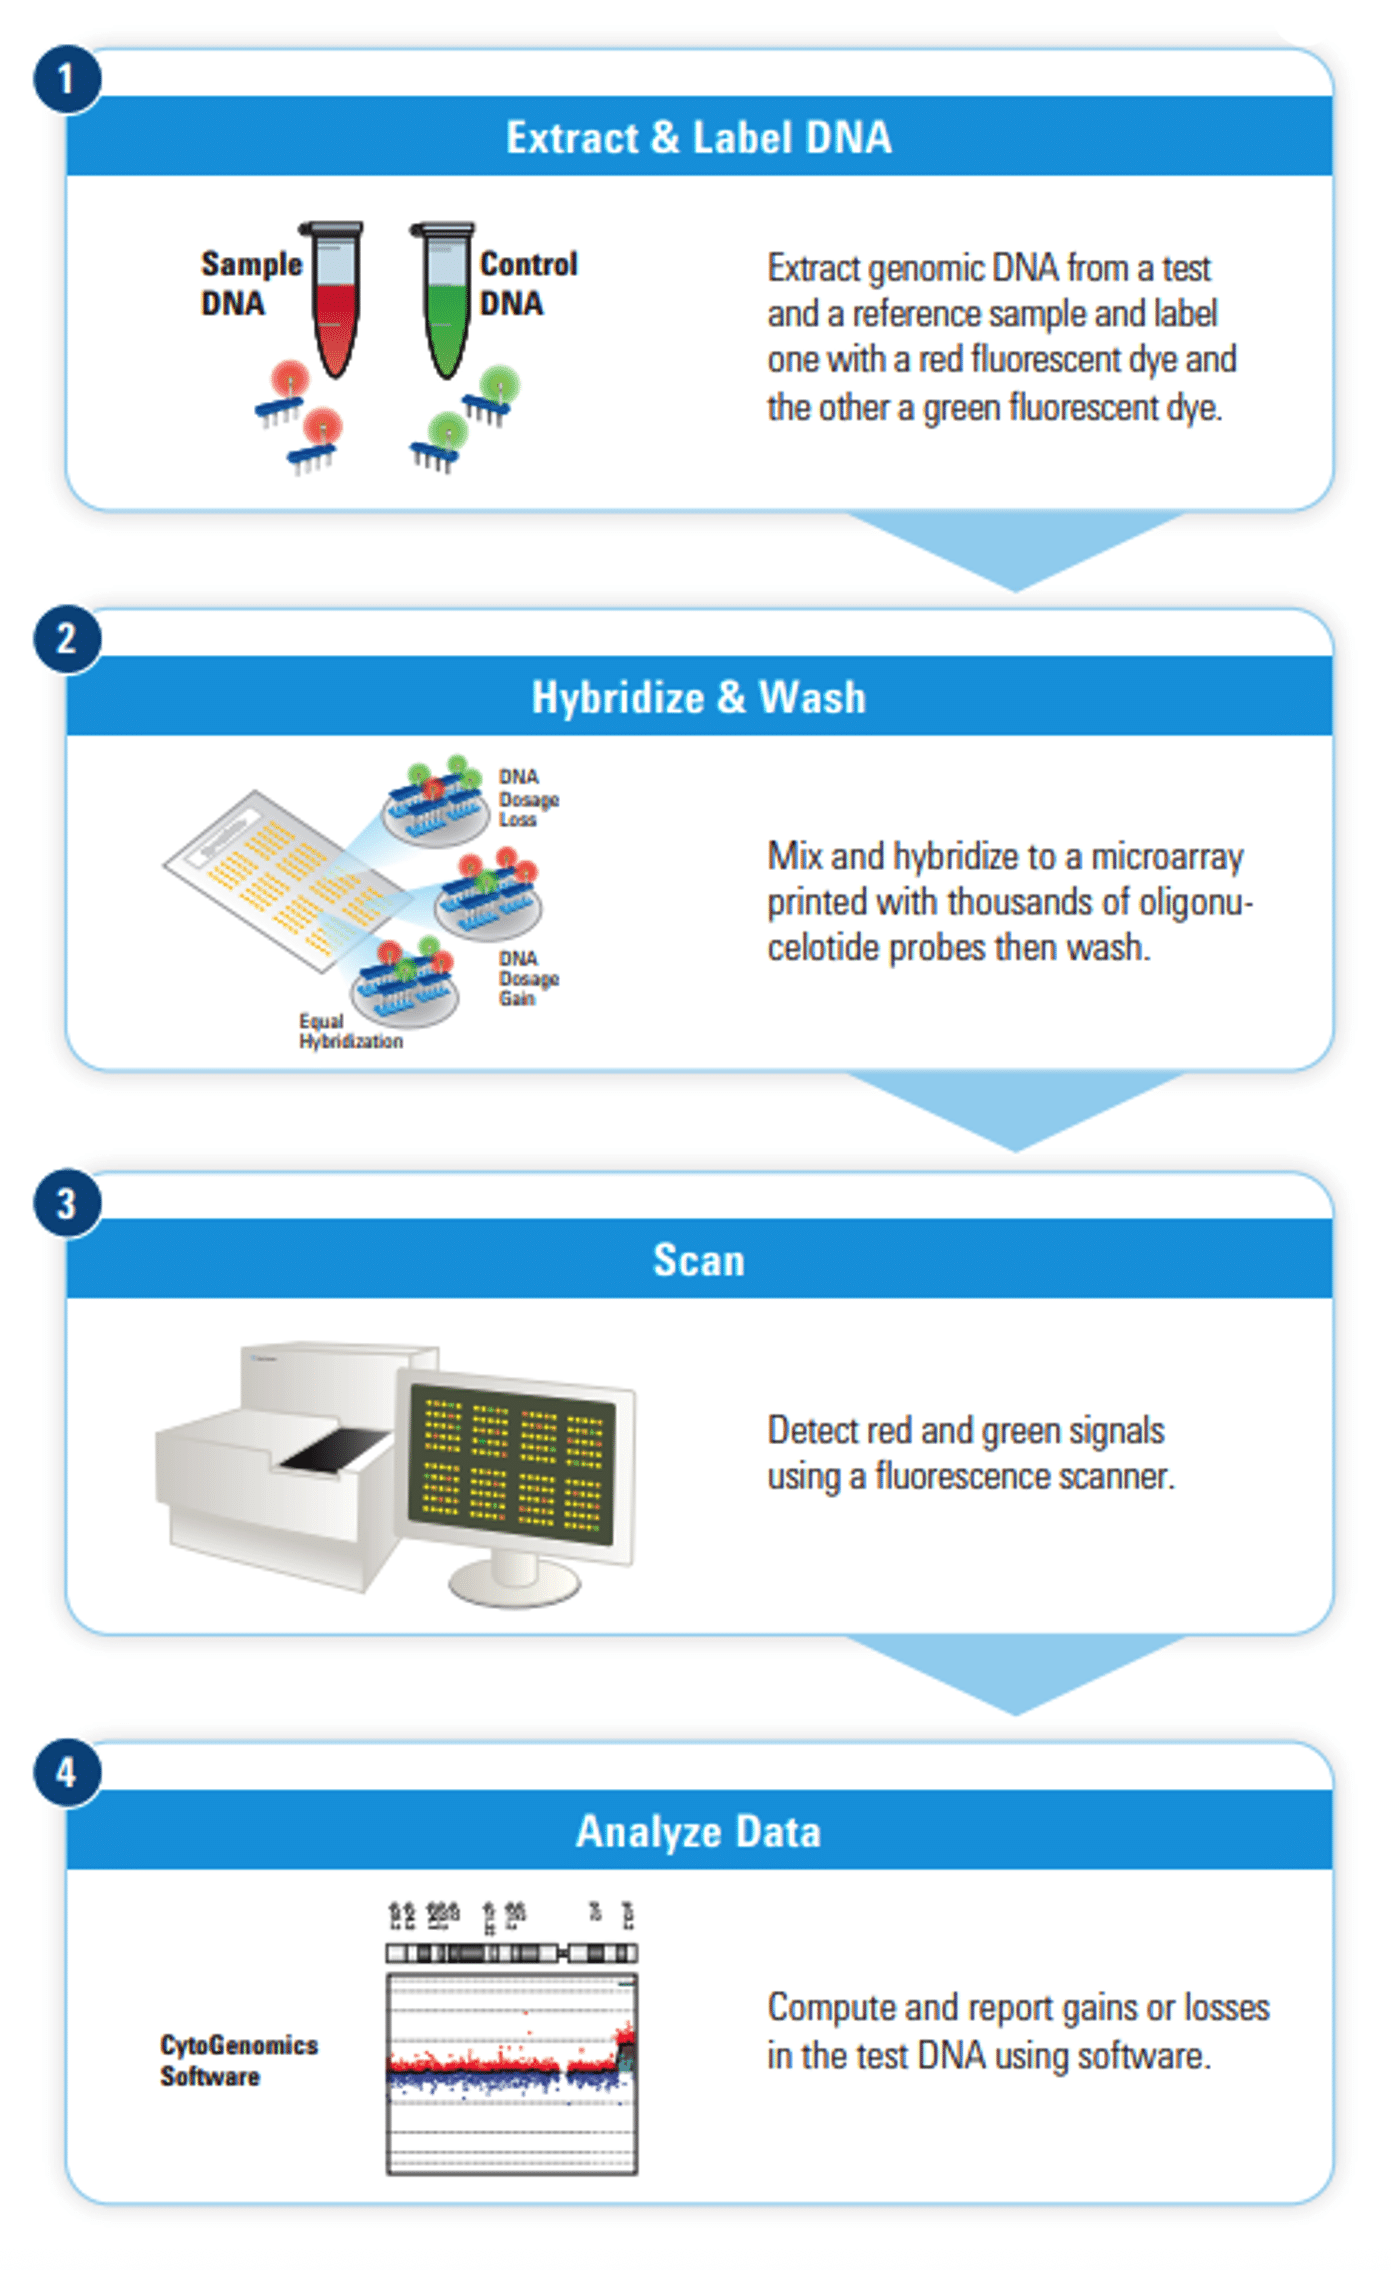
Such a solution would be incomplete without software to make sense of the array findings. CytoGenomics is Agilent’s software offering which can streamline the cytogenetic sample analysis workflow. CytoGenomics allows for a fully automated workflow from sample upload to analysis, a robust and intuitive user interface allowing for manual sample analysis, and a flexible reporting system. The system is highly customisable and can allow for modifications of analysis parameters.
General layout
CytoGenomics software has a layout similar to a web browser, with tabs at the top of the software window allowing for easy navigation between menus (Figure 2.). Once all supporting files have been loaded into the software using the “Supporting Files” tab, samples can be imported and analysed if following a manual workflow. Samples are imported using the “Analysis Workflow” tab. Data can be imported as extracted microarray text files, or microarray TIFF image files (such as those generated by the Agilent SureScan microarray).
Uploading a case for analysis is straightforward; the user would select the sample to be analysed in a .txt or .tif format (Figure 2. a)), assign an analysis method to the data which is a set of instructions that tells the CytoGenomics software how to analyse sample data from a microarray (Figure 2. b)), import sample attribute information to map the sample to the array and then the analysis can take place by the software (Figure 2. c)). Automation can be set up by linking a particular array design with a workflow that can be pre-defined in the software settings and then using the “Auto Processing” feature, so that as TIFF files are generated by a microarray scanner, the software can automatically detect these in a shared folder and begin processing in the background.
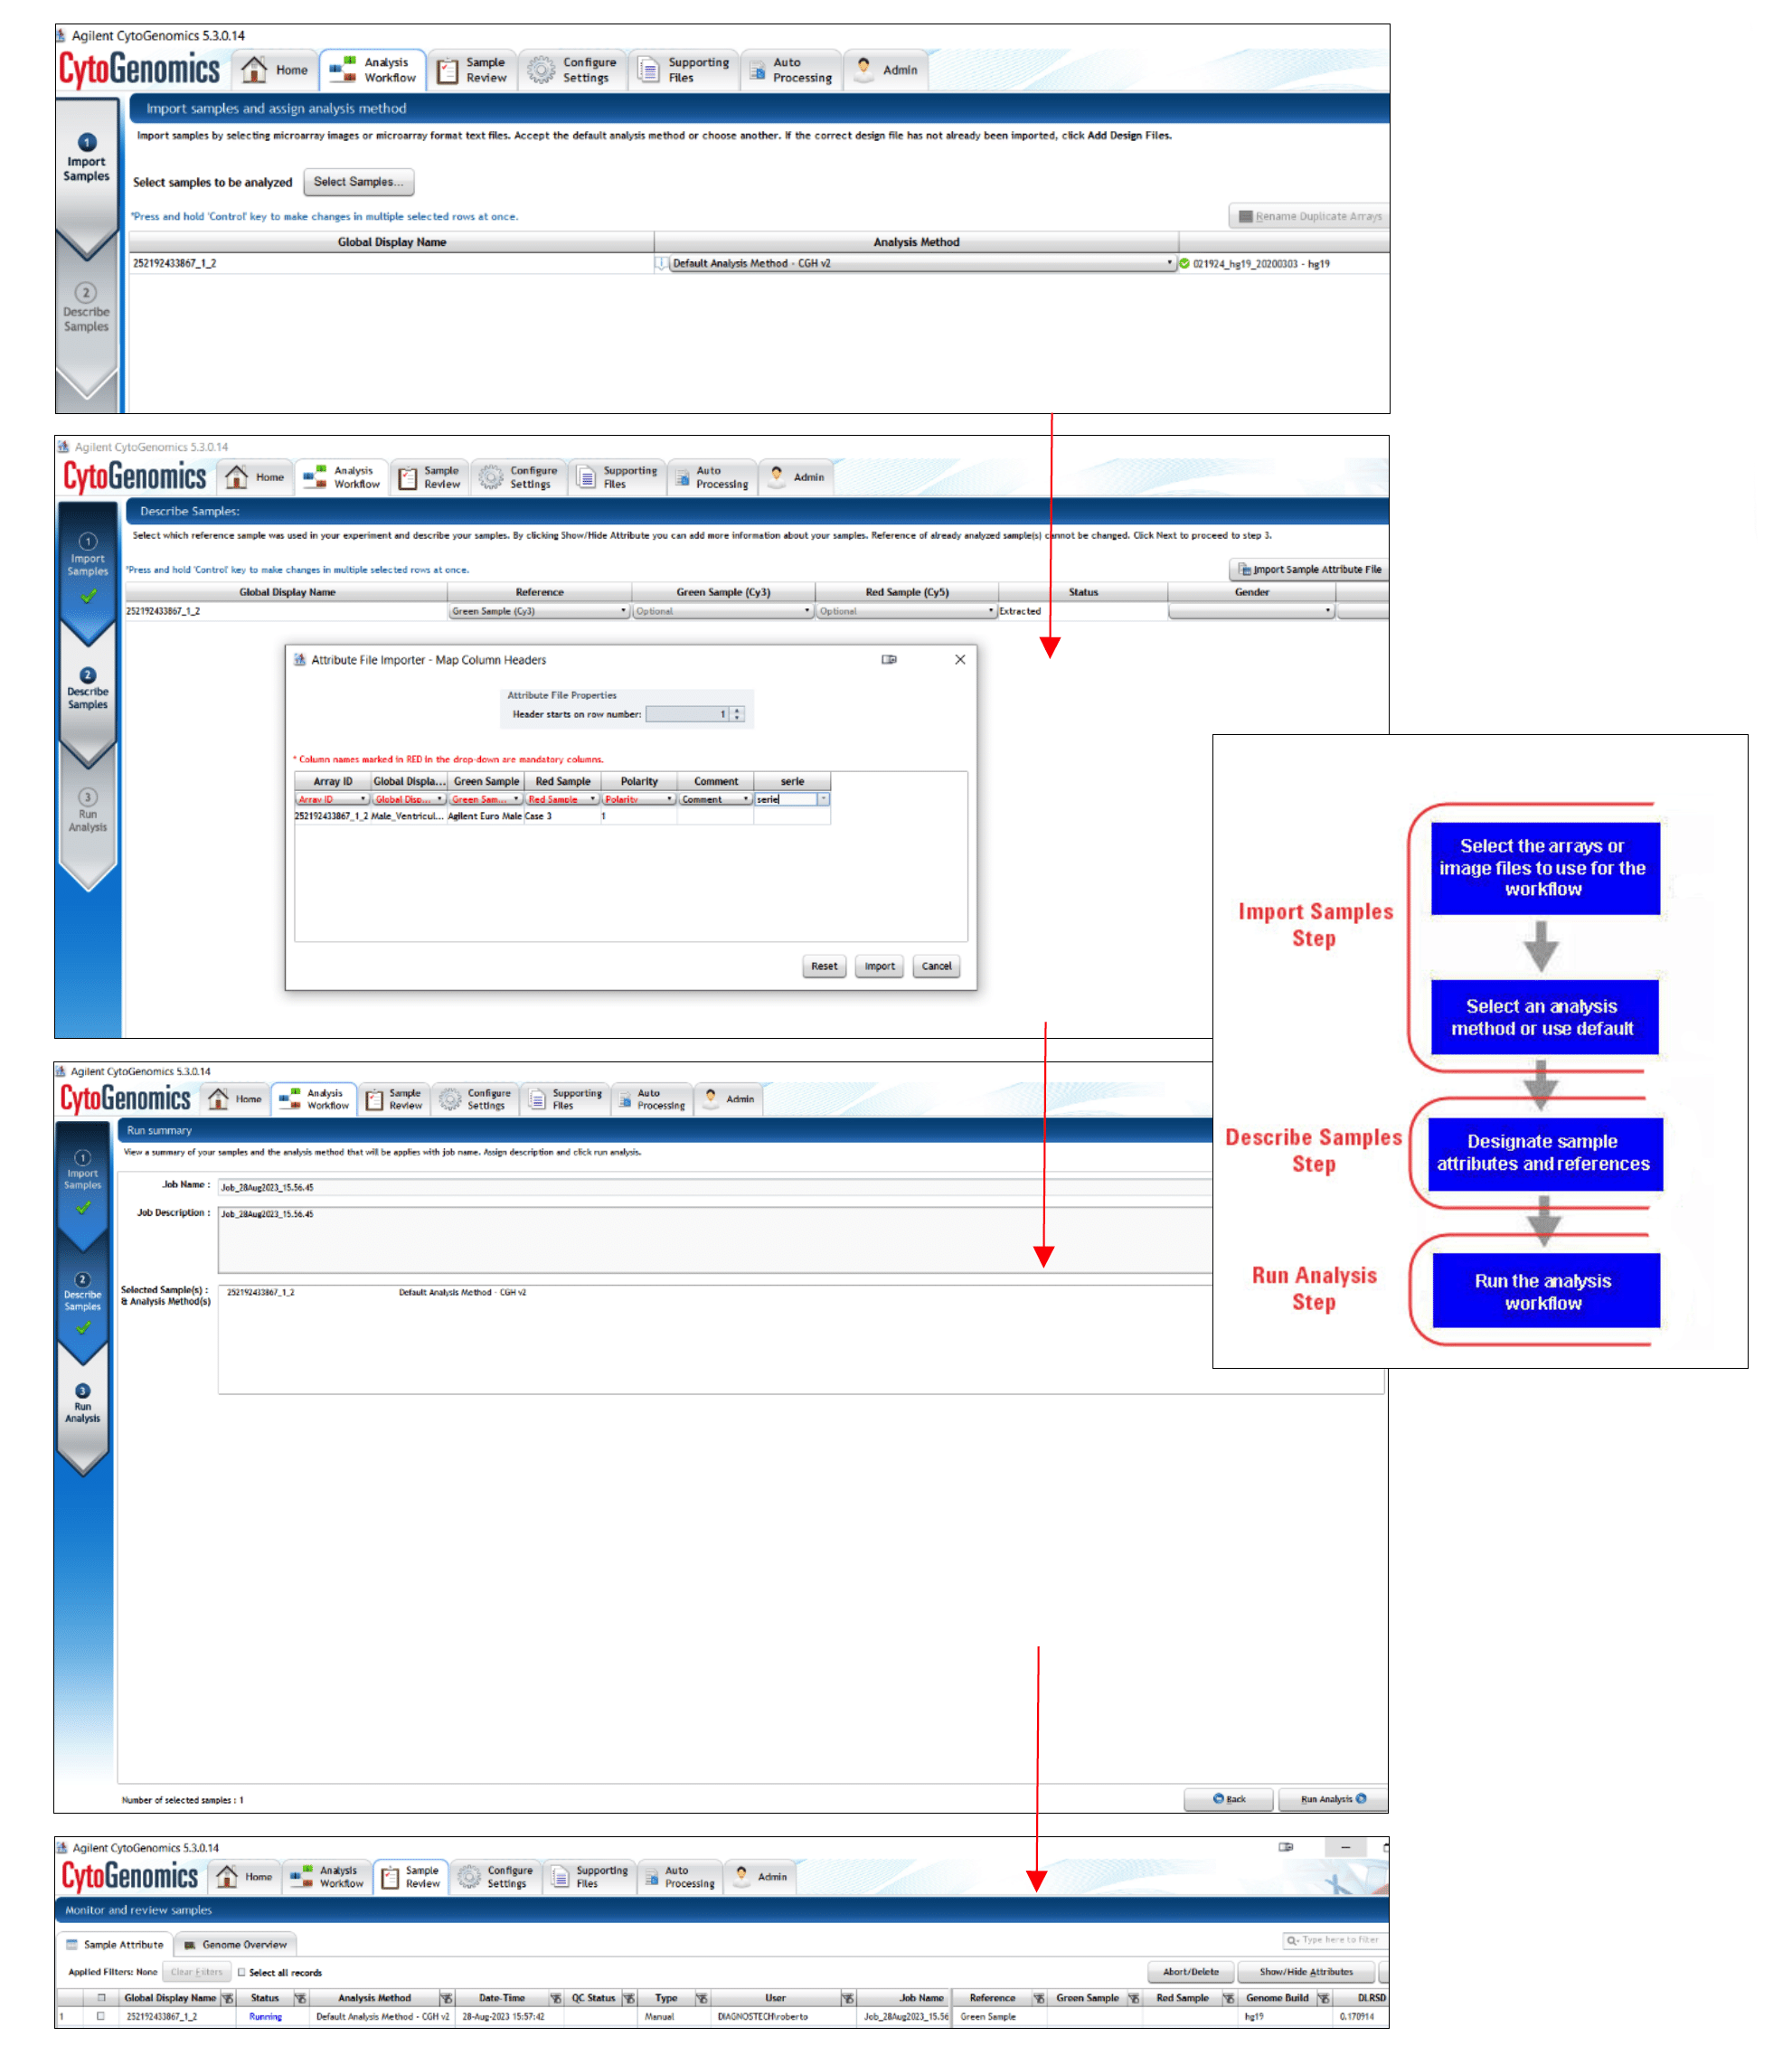
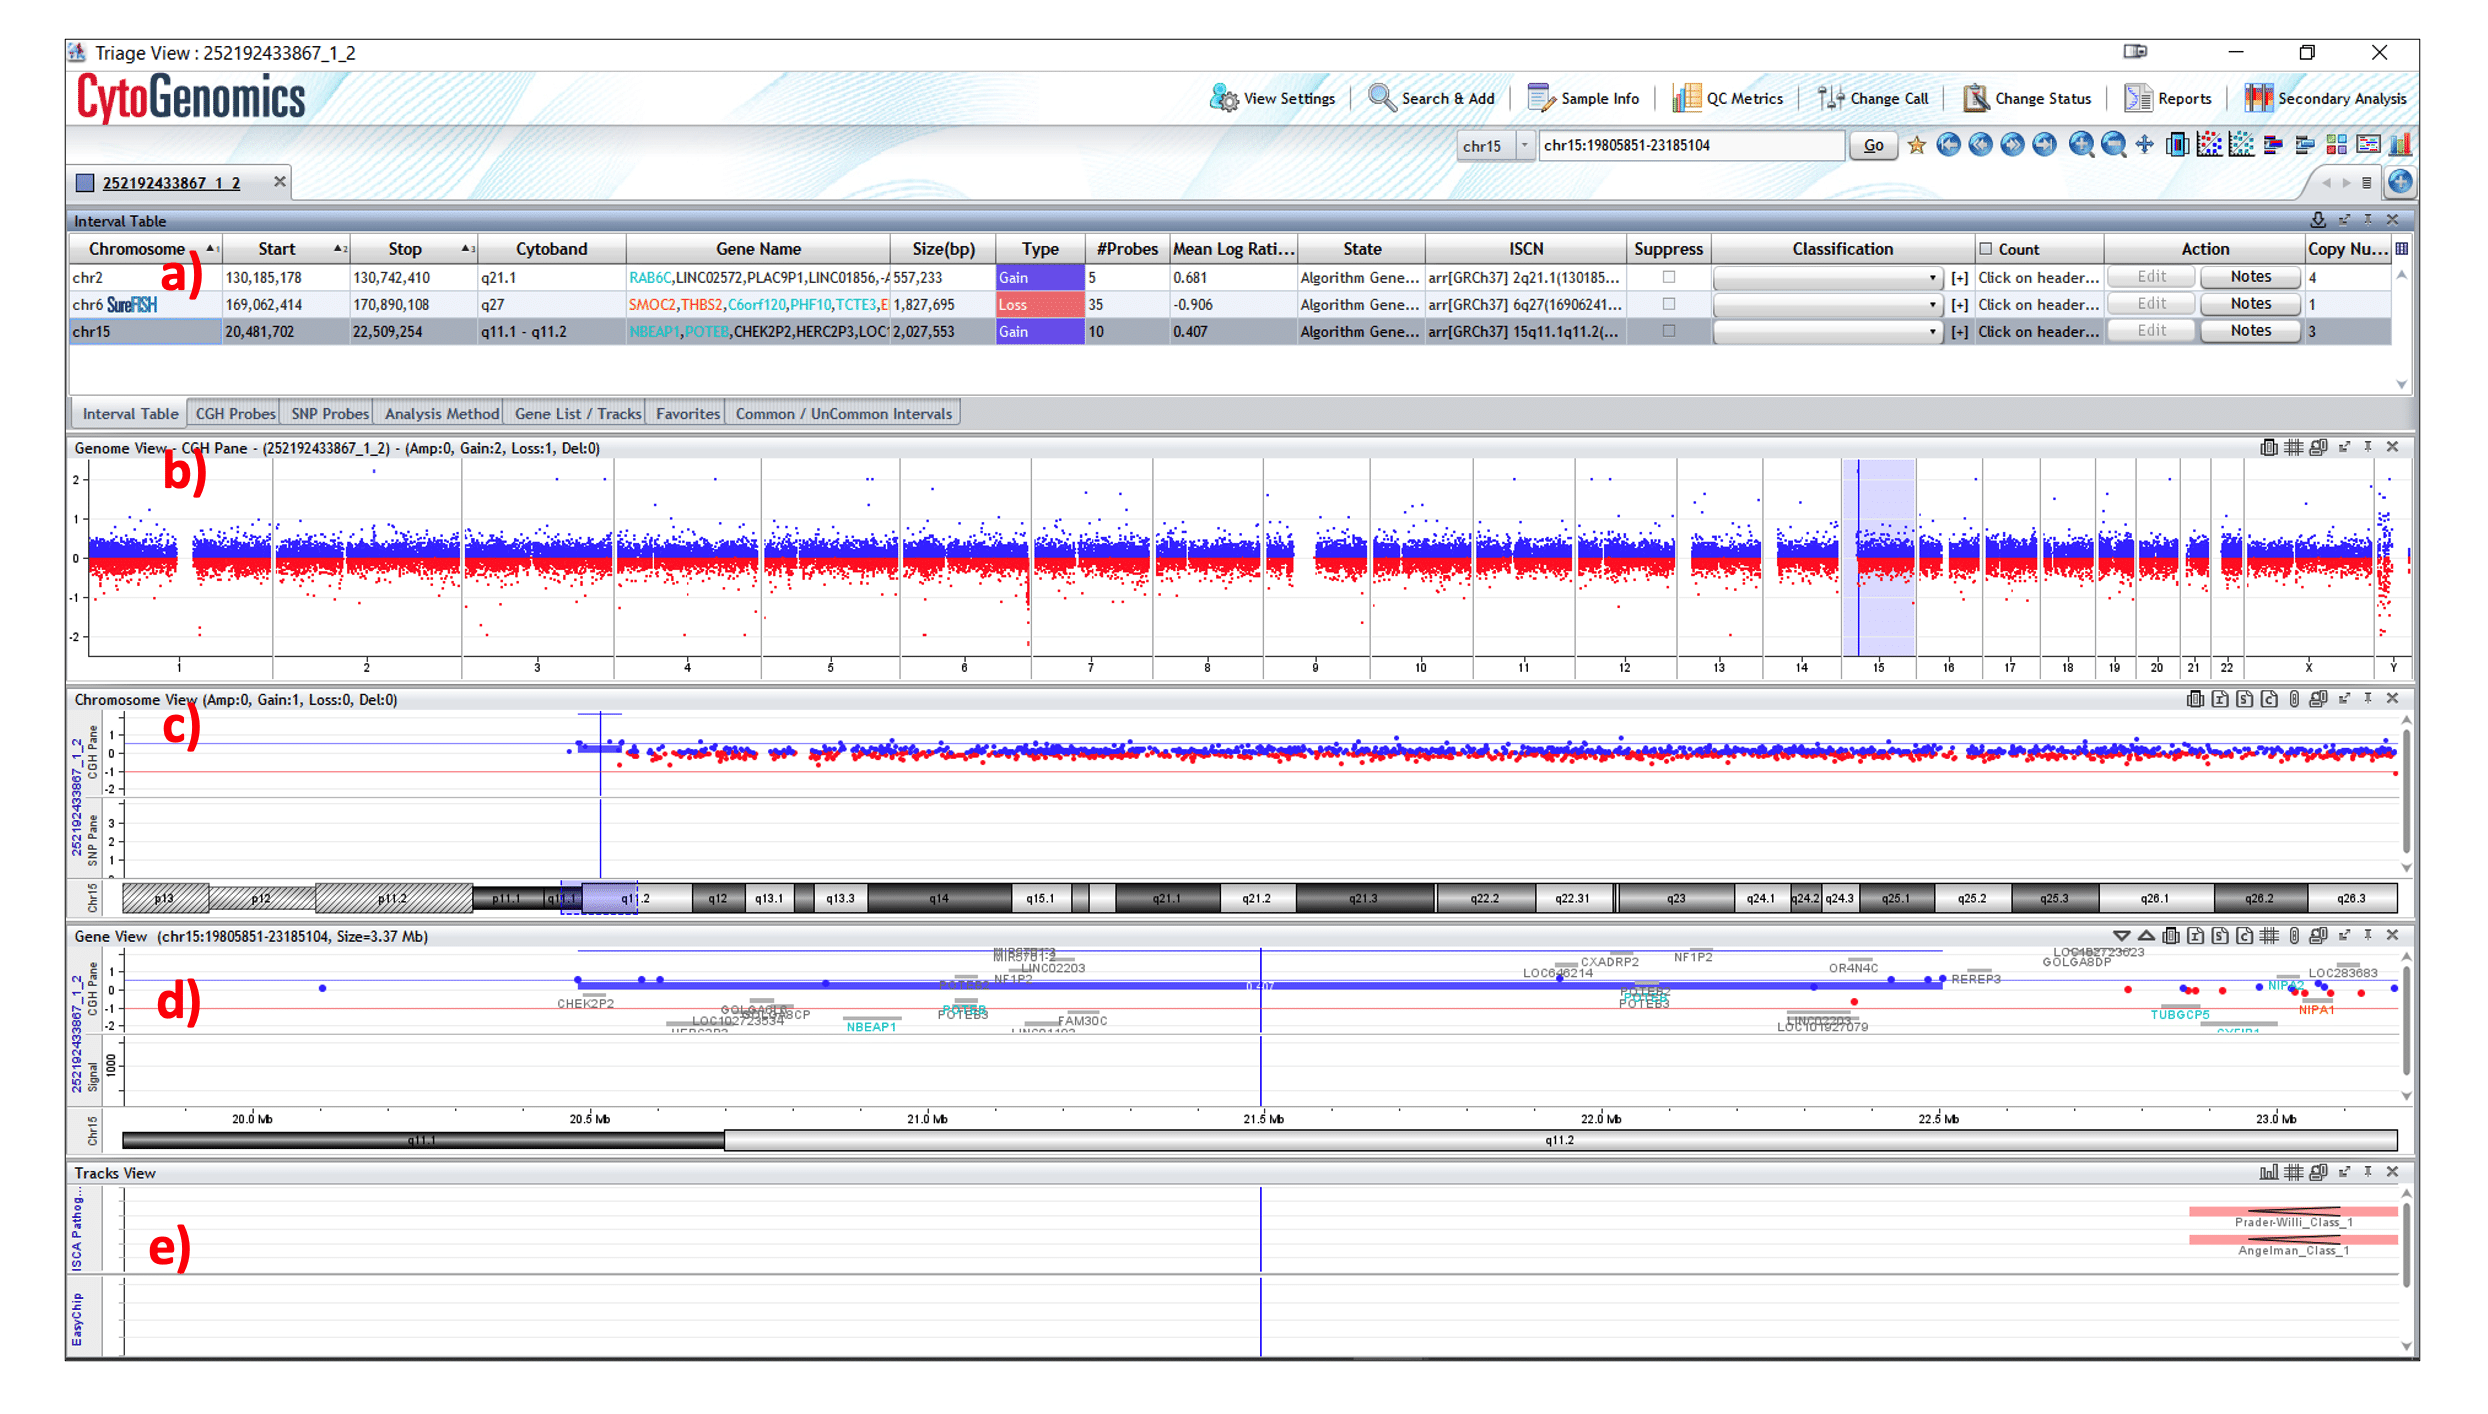
The “Sample Review” tab allows for the monitoring of the progress of workflow jobs, opening of sample results for completed workflow jobs, and accessing reports for sample results (Figure 2. d)). In the “Sample Review” tab, manual review and analysis of cases can also be done using the sample Triage View (Figure 3.). Using this view, one can visualise the log2 ratios of the CGH probes superimposed across a genome and examine, annotate, and edit analysis results for one or more samples. Users with the role of “Scientist” or “Administrator” can also sign off the results and generate final reports.
The Genomic Viewer allows the user to visualise the patient sample in a few ways allowing for a thorough analysis of the data (Figure 3.). The viewer is organised in such a way that various parts of the genome can be visualised at the same time, each displaying pertinent data.
a) The “Interval Table” lists all the aberration calls detected by the software or those that have been added by the user. Important information displayed includes the chromosome position, the genes that overlap the aberration including colour coding for benign and deleterious genes, sizing of the interval, the number of CGH probes that overlap that region, the mean log ratio for the aberration and the classification of the aberration (pathogenic, benign etc.).
b) The “Genome View” displays images of all the chromosomes in the sample, with the locations of aberrations denoted as horizontal lines. The viewer also displays the amplifications (AMP), gains, losses, deletions (DEL), and LOH intervals detected in the samples.
c) The “Chromosome View” displays data for each selected individual chromosome, including CGH probes and SNPs.
d) The “Gene View” provides the most granularity, displaying data as a graphical representation of the aberrations in the samples using an interface that looks and functions like a genome browser. Users have the option to connect with external resources like the UCSC Genome Browser or the Database of Genomic Variants (DGV) to access additional annotation information regarding specific genetic regions of interest. There is also a separate pane to display SNP information if a combined CGH+SNP array was used.
e) The “Tracks View” displays annotations for mappings of known and expected genes, and aberrations of interest. The data for these tracks are pulled from various online data repositories such as Online Mendelian Inheritance in Man (OMIM), RefSeq and International Standards for Cytogenomic Arrays (ISCA). It is also possible to view frequency plots or heatmaps in the Tracks View, this allows the visualisation of the interval density across a genomic region rather any one individual gene interval.
Reports
After analysis is complete of a sample and signed off, a “Cyto Report” can be generated summarising the key patient data, with default templates already available and customisation possible. Data in the report can include analysis settings used, and key information about the aberrations that were detected including locations of said aberrations, with images and the Interval Table derived from the Genomic Viewer also included. Any notes added by the user during analysis can also be exported in the Cyto Report.
QC Metrics
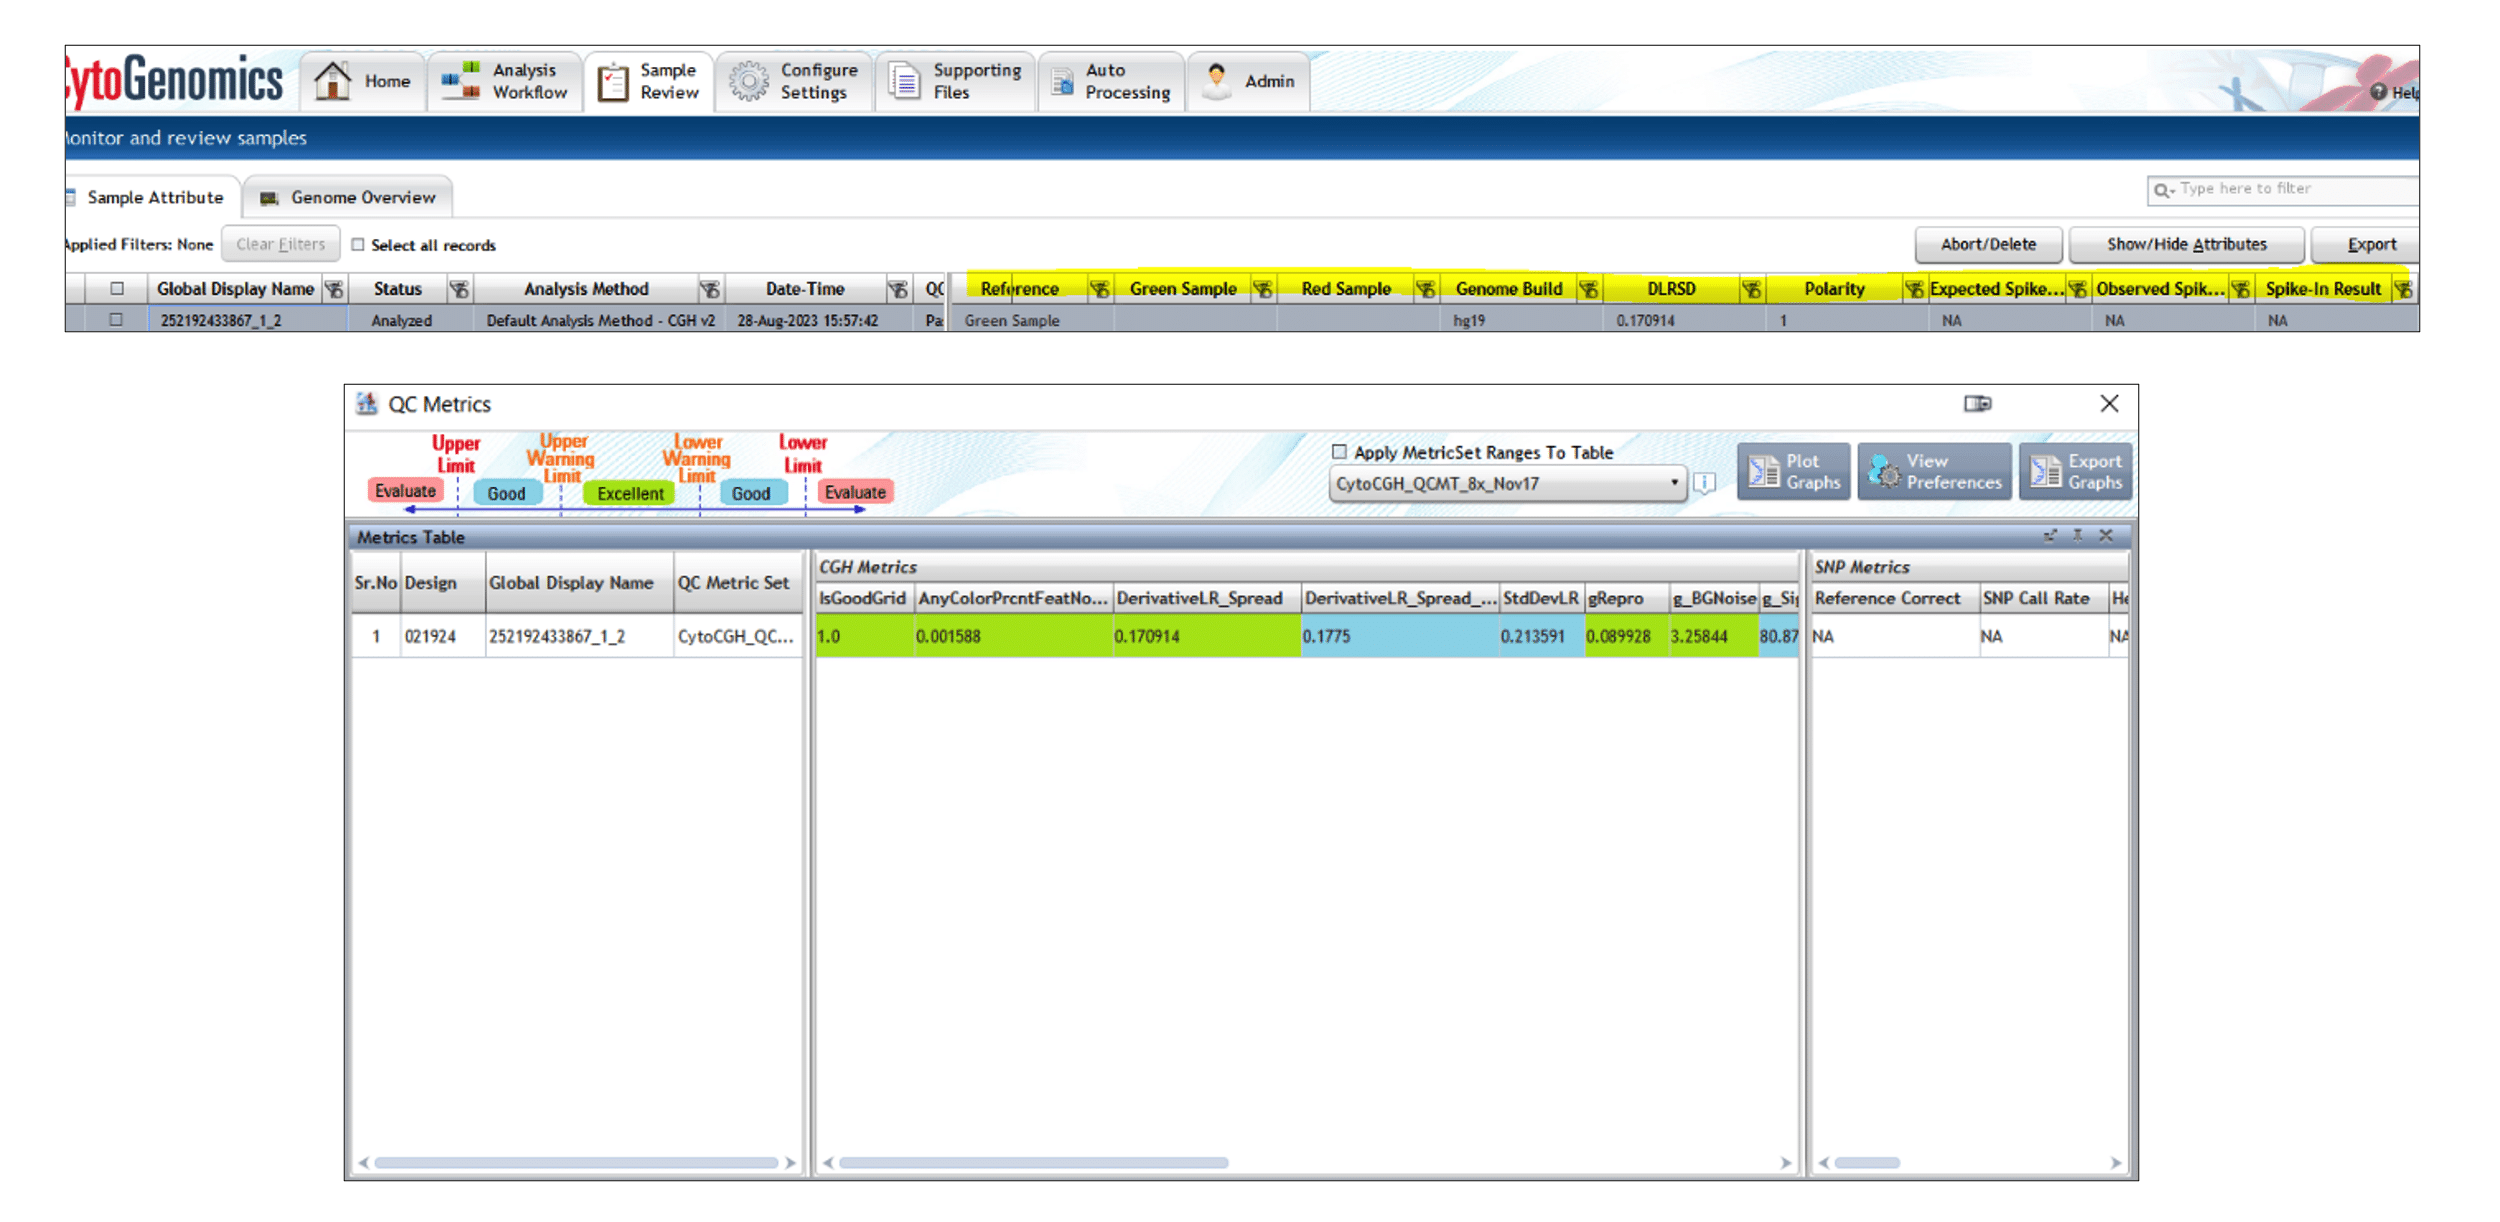
The quality of data analysis is only as robust as the actual data that one inputs; garbage in, garbage out. CytoGenomics employs several quality control (QC) metrics that ensure the robustness of data analysed. QC metrics for specific or multiple samples can be accessed through the “Sample Review” tab and the QC metrics can also be displayed per sample under “Sample Attribute” tab in “Sample Review” allowing the user to quickly visualise important metrices in a table format, per sample. QC metrics are also easily accessible in the Triage View as well.
A whole host of metrices are provided by the software by default, for both CGH and SNPs. These come as various “sets” that can be edited in the “Configure Settings” tab. Parameters for each of these metrics define the criteria that the software uses to assign each metric for a sample as Excellent, Good, or Evaluate, with values defined for a lower and upper limit for each metric. A colour is also assigned to each metric, with Excellent being green, Good being blue, and Evaluate red.
A few of the CGH metrics that are used in the software to assess the quality of processing of a sample are described below.
- IsGoodGrid tracks automatic grid-finding.
- DerivativeLR_Spread (DLRS) is a particularly important metric and determines the spread of the log ratio differences between consecutive probes along all chromosomes. This metric is essentially a type of estimate of the noise in the sample; a DLRS value of <0.2 is considered excellent, a score between 0.2 and 0.3 is considered good and a score >0.3 is classed as “evaluate”.
- Signal2Noise for red and green determines the signal to noise ratio in either channel.
- SignalIntensity for red and green is the background-subtracted signal intensity of either channel at the 50th percentile for all non-control probes.
- LogRatioImbalance is the percentage of probes showing log ratio values above or below a predetermined threshold for a dynamically determined chromosome. Essentially, the metric looks for imbalances in log ratios across the case genome that are abnormal or unexpected. A +ve value above expected indicates a shift towards amplifications whereas a -ve value below expected indicates a shift towards deletions.
A few of the SNP-specific QC metrics are listed below.
- DerivativeLR_Spread_Norm is similar to the DLRS metric used for CGH and is a measure of probe-to-probe noise, but only using normalised and filtered log ratios.
- Reference Correct measures the correlation between the specified genotypes of the SNPs and the corresponding signal of the reference channel. A value that is low is indicative of the wrong reference sample being assigned in the sample description step.
- SNP Call Rate is the number of SNPs that receive a genotype call at a 95% threshold divided by the total number of SNPs for which there is signal in the reference. For high-quality DNA samples hybridised against a genotyped and qualified reference, this value should exceed 90%.
- Heterozygosity is the fraction of heterozygous SNPs in a sample, calculated as the ratio of heterozygous SNPs to all the SNPs on the array. If the sample has many LOH regions, such as in a sample with uniparental disomy or consanguinity, this fraction is low. Very low or very high levels of heterozygosity can also result from errors in the fitting of the SNP distribution.
- cnLOH Fraction is the fraction of the entire genome that is homozygous in a sample. It is an important metric for the analysis of consanguineous samples.
The above are only a few of the metrics used by CytoGenomics to assess quality of data.
Agilent CytoGenomics Database and set-up
CytoGenomics is structured around a “client-server” model. All array data imported into CytoGenomics is stored in a PostgreSQL “database” server, and “client” software then has accesses to this data. When set-up on a single computer, the client-server would be on the same computer. If CytoGenomics is installed on other computers that have network access to the database server, they can act as clients and access the data hosted on the server database. CytoGenomics on the client computers should have full analysis functionality, dependent of course on the limitations of the local area network and processing speed of the said machines.